Scaling text box on the overlap visualisation

XMLWordPrintable

    • Type: New Feature
    • Resolution: Fixed
    • Priority: Minor
    • Component/s: Charting
    • None

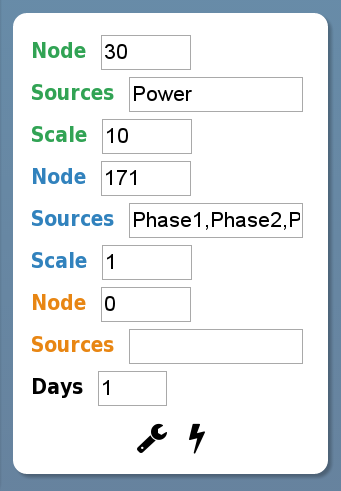
      the same way there's a scale text box to make a "virtual" solar array as a multiple or fraction of an actual system on the Power I/O chart could there be the similar set of Scale text boxes on this visualisation:

      https://data.solarnetwork.net/dev/charts/power-area/power-area-overlap.html?nodeId=120&consumptionNodeId=120&consumptionSourceIds=House,HotWater&sourceIds=Solar

      so that we can alter the size of the solar in particular to simulate a system against an Audit customer's consumption.

            Assignee:
            Matt Magoffin
            Reporter:
            John Gorman
            Votes:
            0 Vote for this issue
            Watchers:
            2 Start watching this issue

              Created:
              Updated:
              Resolved: